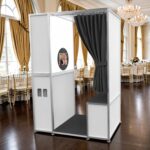
The median wedding photo booth booking is $886. In a transaction analysis of roughly 118,000 photo booth rentals, the middle 50% of wedding bookings fell between $631 and $1,305, while the highest-priced 10% exceeded $1,973. The broader demand environment is substantial: the United States recorded more than 2.1 million marriages in 2024, and commercial research estimates about 2.01 million weddings and $66.16 billion in wedding spending during 2025.
Research-scope note: Photo booth pricing, marriage registrations and wedding-market spending come from different sources with different definitions. They are presented separately and should not be combined into a single market total. No dependable current public dataset was found showing the percentage of all U.S. weddings that hire a photo booth.
Key wedding photo booth statistics
- $886 median wedding photo booth booking
- $631–$1,305 middle 50% of measured wedding bookings
- More than $1,973 for the highest-priced 10% of wedding bookings
- 2,128,446 registered U.S. marriages in 2024
- 2,011,044 estimated U.S. weddings in 2025
- $66.16 billion in estimated U.S. wedding spending during 2025
- $34,200 average wedding cost in The Knot’s study of couples married in 2025
- 117 guests and 13 vendors at the average wedding in The Knot’s 2026 study
- 76% of weddings typically occur from May through October
- 15 months average U.S. wedding-planning lead time in The Knot Worldwide’s 2025 global report
Wedding photo booth statistics at a glance
| Metric | Statistic | Reference period | Scope |
|---|---|---|---|
| Wedding booth 25th percentile | $631 | Bookings from January 2024 onward | Check Cherry platform sample |
| Median wedding booth booking | $886 | Bookings from January 2024 onward | Bookings with wedding occasion recorded |
| Wedding booth 75th percentile | $1,305 | Bookings from January 2024 onward | Bookings with wedding occasion recorded |
| Top-10% wedding booth threshold | More than $1,973 | Bookings from January 2024 onward | Bookings with wedding occasion recorded |
| Registered marriages | 2,128,446 | 2024 | United States; CDC provisional data |
| Marriage rate | 6.3 per 1,000 people | 2024 | United States; CDC provisional data |
| Estimated weddings | 2,011,044 | 2025 | United States; The Wedding Report estimate |
| Estimated wedding spending | $66.16 billion | 2025 | United States; The Wedding Report |
| Average wedding cost | $34,200 | Couples married in 2025 | The Knot survey of 10,474 U.S. couples |
| Median wedding spend | $18,231 | 2025 | The Wedding Report estimate |
| Average guest count | 117 | Couples married in 2025 | The Knot 2026 Real Weddings Study |
| Average cost per guest | $292 | Couples married in 2025 | The Knot 2026 Real Weddings Study |
| Average vendors hired | 13 | Couples married in 2025 | The Knot 2026 Real Weddings Study |
| Peak-season share | 76% | May through October | The Knot wedding-season data |
| Average U.S. planning lead time | 15 months | 2025 report based on 2024 newlyweds | The Knot Worldwide global report |
Download the structured data: CSV
How much does a wedding photo booth cost?
Check Cherry’s 2026 pricing analysis examined roughly 118,000 aggregated photo booth bookings from January 2024 onward. Occasion was recorded for approximately one-third of bookings. Within the wedding subset, the median event total was $886.

| Price benchmark | Event total | How to interpret it |
|---|---|---|
| 25th percentile | $631 | One-quarter of measured wedding bookings were at or below this amount. |
| Median | $886 | Half of measured wedding bookings were below this amount and half were above it. |
| 75th percentile | $1,305 | One-quarter of measured wedding bookings exceeded this amount. |
| Top-10% threshold | More than $1,973 | The highest-priced 10% of measured wedding bookings exceeded this total. |
The middle 50% of measured wedding bookings spans $674, from $631 to $1,305. That range illustrates why one national price cannot describe every package. Booth format, staffing, active hours, prints, travel, customization, venue requirements and local demand all influence the final total.
The highest-priced 10% threshold is approximately 123% above the median. This is an ATA calculation based on Check Cherry’s published wedding price points.
Pricing-scope note: Check Cherry publishes dollar-denominated platform data but does not provide a country-by-country breakdown for the pricing dataset. Use these figures as transaction benchmarks relevant to U.S. buyers and operators, not as an official government U.S. average.
How does a photo booth fit into the wedding budget?
The Knot’s 2026 Real Weddings Study reported an average wedding cost of $34,200 for U.S. couples married in 2025. The Wedding Report estimated a lower $18,231 median wedding spend. The median wedding photo booth booking represents a different percentage depending on which total is used.
| Comparison | Wedding-market benchmark | $886 booth median as a share |
|---|---|---|
| The Knot average wedding cost | $34,200 | 2.6% |
| The Wedding Report median wedding spend | $18,231 | 4.9% |
| Average additional non-musical entertainment | $1,500 | 59.1% |
| Average event rentals | $2,000 | 44.3% |
| Average reception DJ | $1,800 | 49.2% |
| Average wedding photographer | $3,000 | 29.5% |
These percentages are ATA calculations combining separate datasets. They provide context; they do not mean every couple assigns the same share of the budget to entertainment.

Dividing $886 by The Knot’s average guest count of 117 produces an illustrative equivalent of approximately $7.57 per guest. A booth is usually priced as a package rather than a true per-person service, so this figure should not be used as a quote formula.
How large is the U.S. wedding market?
The Wedding Report estimates that the United States hosted 2,011,044 weddings in 2025, generating approximately $66.16 billion in wedding spending. It estimates an average wedding cost of $32,899 and a median of $18,231.
The Knot Worldwide’s 2026 Real Weddings Study describes a broader U.S. wedding industry exceeding $100 billion. The difference reflects methodology and market definition. The Knot’s broader statement may encompass a wider range of wedding-related spending than The Wedding Report’s visible market total.
| Source | Statistic | Reference period | Interpretation |
|---|---|---|---|
| The Wedding Report | 2,011,044 weddings | 2025 | Estimated annual wedding count |
| The Wedding Report | $66.16 billion | 2025 | Estimated wedding-market spending |
| The Wedding Report | $32,899 average | 2025 | Average wedding spending |
| The Wedding Report | $18,231 median | 2025 | Half of weddings were estimated below this amount |
| The Knot Worldwide | More than $100 billion | 2025 weddings | Broader wedding-industry statement |
These market totals are demand indicators for vendors. They are not photo booth revenue and should not be added to photo booth industry market-size estimates.
U.S. marriage trends connected to wedding demand
The CDC provisionally recorded 2,128,446 U.S. marriages in 2024, equal to 6.3 marriages per 1,000 people. The marriage count increased approximately 4.2% from 2023 and was approximately 5.6% above the 2019 count.

| Year | Marriages | Rate per 1,000 population |
|---|---|---|
| 2019 | 2,015,603 | 6.1 |
| 2020 | 1,676,911 | 5.1 |
| 2021 | 1,985,072 | 6.0 |
| 2022 | 2,065,905 | 6.2 |
| 2023 | 2,041,926 | 6.1 |
| 2024 | 2,128,446 | 6.3 |
Although the 2024 marriage count exceeded the 2019 level, the 2024 marriage rate remained approximately 23% below the 2000 rate of 8.2 per 1,000 people. Counts and rates answer different questions: the count reflects the size of the population and number of marriages, while the rate normalizes for population.
Wedding season and photo booth booking timing
The Knot’s wedding-season analysis, updated in May 2026, reports that 76% of weddings typically take place from May through October. October and June each account for 16%, followed by May at 14%, September at 13% and August at 10%. December is the least-popular month at 1%.

| Period | Share of weddings | Planning implication |
|---|---|---|
| May through October | 76% | Peak demand for venues and many wedding vendors |
| October | 16% | Tied for the most popular month |
| June | 16% | Tied for the most popular month |
| May | 14% | Major late-spring wedding month |
| September | 13% | Major fall wedding month |
| August | 10% | Fifth-most-popular month in the cited data |
| December | 1% | Least-popular wedding month in the cited data |
The Knot Worldwide’s 2025 Global Wedding Report found that U.S. couples in its study planned for an average of 15 months, the longest planning lead time among the countries measured. That report surveyed 16,956 U.S. newlyweds married in 2024.
For photo booth operators, the practical inference is to market and build venue or planner relationships well before peak dates. The 15-month planning average does not mean every couple books a photo booth 15 months before the wedding; the public report does not provide a photo-booth-specific booking lead time.
Wedding guest count and vendor-team statistics
The Knot’s 2026 study reports an average of 117 guests, an average of $292 per guest and an average of 13 hired vendors. Two in three surveyed couples said hiring wedding professionals was essential.
| Metric | Statistic | Source scope |
|---|---|---|
| Average guest count | 117 | 10,474 U.S. couples married in 2025 |
| Average cost per guest | $292 | The Knot 2026 Real Weddings Study |
| Average vendors hired | 13 | The Knot 2026 Real Weddings Study |
| Couples saying professionals are essential | Two in three | The Knot 2026 study |
| Couples booking a venue | 89% | The Knot 2026 study |
| Couples hiring a photographer | 88% | The Knot 2026 study |
| Couples securing a caterer | 85% | The Knot 2026 study |
Average wedding cost by guest-count range
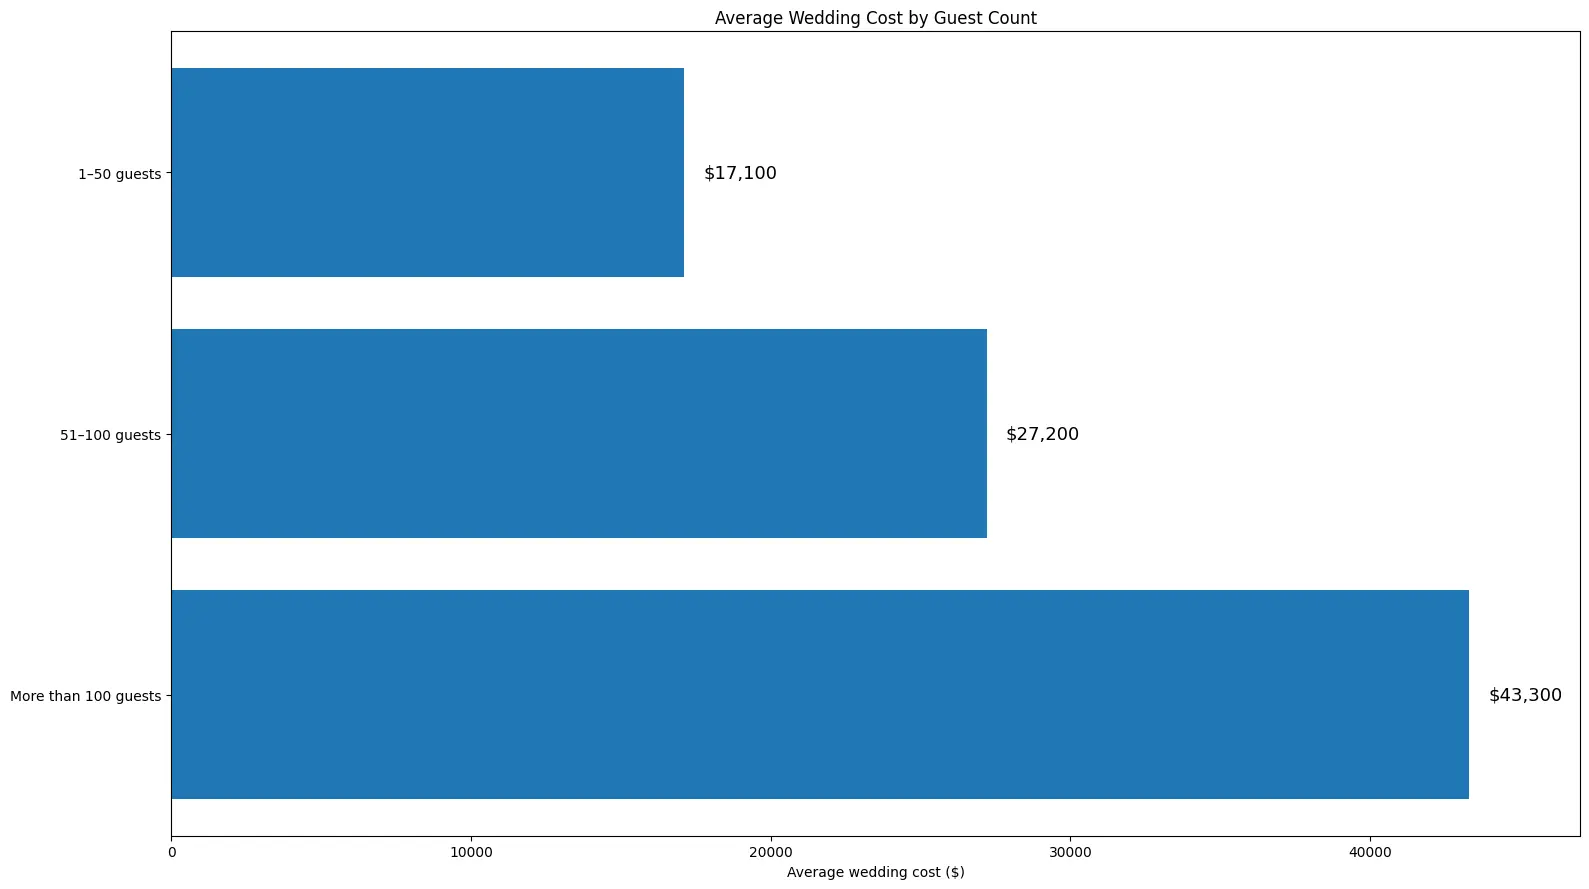
| Wedding size | Average wedding cost |
|---|---|
| 1–50 guests | $17,100 |
| 51–100 guests | $27,200 |
| More than 100 guests | $43,300 |
These are total wedding-cost averages. The data does not show that wedding photo booth pricing rises by the same percentage as guest count. A booth quote often contains substantial fixed costs for equipment, delivery, setup and design.
Photo booth format pricing relevant to wedding operators
The following format benchmarks include all identifiable event types in Check Cherry’s transaction analysis; they are not wedding-only prices. They help wedding operators understand how different experiences are positioned across the broader event market.
| Booth format | Median booking | Wedding-use consideration |
|---|---|---|
| Classic or open-air | $615 | Flexible footprint, group photos and backdrop customization |
| Roaming | $702 | Cocktail hour, tableside coverage and candid guest interaction |
| 360 booth | $750 | Video-forward experience requiring more space and monitoring |
| Mirror booth | $866 | Formal visual presentation and premium reception positioning |
| Glam booth | $950 | Premium portrait look and high-end package positioning |
Approximately 62% of Check Cherry bookings used generic package names and were excluded from the format comparison. Operators should not assume that selecting a particular booth automatically produces the published median. Service design, sales positioning, hours, staffing and local demand still matter.
Wedding-focused businesses can compare ATA’s iPad photo booths, DSLR photo booths, mirror photo booths, vintage enclosed photo booth, photo booth printers and wedding-ready backdrops.
Guest experience, personalization and shareable content
The Knot Worldwide’s 2025 Global Wedding Report included an Instagram poll with more than 1,000 responses. This was a social-media poll—not a representative national survey—but it provides useful context about guest-experience priorities:
- Nearly 6 in 10 respondents said the last three weddings they attended felt similar.
- 36% described personalized touches as the most memorable element.
- 23% selected food and drinks.
- 21% selected entertainment.
- Approximately 8 in 10 said it was extremely important that their own wedding feel personal.
- 68% wanted guests to feel as though they had never attended another wedding like theirs.
- Nearly 50% said their top worry was that guests would not have fun.
The Knot’s 2026 Real Weddings Study also found that Gen Z represented 41% of its surveyed wedding market, 61% of couples wrote their own vows, and TikTok use for wedding inspiration had grown 2.5 times in recent years.
It is reasonable to infer that customizable, visual and short-form-video-ready experiences may align with these priorities. The cited studies did not test whether a photo booth itself caused higher guest satisfaction, memorability or social sharing, so this article does not assign a performance percentage to photo booths.
Geographic wedding-spending indicators
Total wedding spending varies substantially by state and metropolitan area. These figures can help operators evaluate the broader budget environment, but they are not local photo booth prices.
| State | Average wedding cost |
|---|---|
| New Jersey | $57,000 |
| Rhode Island | $51,000 |
| New York | $49,000 |
| Vermont | $47,000 |
| Massachusetts | $45,000 |
| Connecticut | $42,000 |
| California | $39,000 |
| Metropolitan market | Average wedding cost |
|---|---|
| New York City | $88,000 |
| Chicago | $54,000 |
| San Francisco | $51,000 |
| Boston | $51,000 |
| Los Angeles | $45,000 |
| Washington, D.C. | $42,000 |
| Philadelphia | $40,000 |
| San Diego | $38,000 |
| Austin | $37,000 |
Local photo booth pricing should be researched using actual competitors, venue requirements, travel radius and the operator’s cost structure. A high total wedding average does not guarantee a proportionally high photo booth rate.
What percentage of weddings use a photo booth?
No dependable current nationwide public figure was identified. Search results frequently repeat precise claims such as 42%, 68% or 92%, but many of those pages do not provide an accessible original survey, sample size, field dates or methodology.
ATA recommends stating the limitation directly rather than publishing an unsupported adoption rate. A defensible answer is:
Photo booths are a recognized wedding-entertainment category, but no current public census establishes the percentage of all U.S. weddings that hire one.
The most reliable public statistics currently describe transaction pricing, marriage and wedding volume, overall wedding spending, seasonality, guest counts and vendor hiring—not national photo booth attachment.
Wedding photo booth quote-comparison checklist
| Quote item | Question to ask |
|---|---|
| Active coverage | How many operating hours are included? |
| Setup and teardown | Are these completed outside the paid reception time? |
| Idle time | Is there a charge between setup and the start of service? |
| Attendant | Will a trained attendant remain with the booth? |
| Booth format | Is the experience open-air, enclosed, mirror, roaming, 360 or another format? |
| Image quality | What camera and lighting system will be used? |
| Printing | Are prints included, and are they unlimited or quantity-limited? |
| Digital delivery | Are text, email, QR code, gallery or video delivery included? |
| Design | How many custom overlay or template revisions are included? |
| Backdrop and props | Which selections are included in the package? |
| Guest book | Does the vendor provide an album, supplies and attendant assistance? |
| Travel | Are mileage, parking, tolls or difficult load-in fees additional? |
| Venue requirements | How much floor space, power and internet access are required? |
| Privacy and consent | How are guest contact details and images stored or used? |
| Backup plan | What happens if equipment or the printer fails? |
| Final total | Are tax, service charges and optional upgrades included? |
What the statistics mean for wedding photo booth operators
1. Price against the service delivered, not one national median
The $886 median sits inside a wide range. Operators should calculate labor, travel, print cost, software, insurance, design time, maintenance and equipment replacement before setting a package price.
2. Prepare inventory and marketing before peak season
With 76% of weddings occurring from May through October and an average U.S. planning lead time of 15 months in the global report, wedding marketing should begin well before the event month. The study does not reveal a universal photo booth booking lead time, so operators should measure their own inquiry-to-event timeline.
3. Build partnerships with the existing vendor team
Couples hire an average of 13 vendors. Venues, planners, photographers, DJs, caterers and rental companies can become referral partners because they interact with the same client and event date.
4. Offer clear package tiers
A practical ladder may include a digital drop-off package, an attended open-air package, a DSLR-and-print package and a premium mirror, enclosed or specialty experience. Each tier should clearly state hours, staffing, print quantity, backdrop, template design and delivery method.
5. Design for personalization without making unsupported promises
Current wedding research emphasizes personal expression, guest experience and shareable visual content. Operators can respond with custom templates, backdrops, guest books, video, GIFs and digital galleries, but should not promise a specific engagement or satisfaction percentage without their own measured data.
6. Track wedding-specific performance
Operators should separately track wedding inquiries, close rate, lead source, average booking value, add-on attachment, travel fees, hours, labor, print cost, referrals and review volume. Original anonymized operator data can eventually become a stronger source than generic market claims.
For broader context, read ATA’s U.S. Photo Booth Industry Statistics 2026, Photo Booth Rental Cost Statistics and Photo Booth Business Revenue and Break-Even Guide.
Research methodology and limitations
ATA Photobooths compiled this article from government vital statistics, large wedding surveys, a commercial wedding-market estimate and a transaction-level photo booth booking analysis. Statistics were not averaged together when their definitions differed.
| Grade | Evidence type | Sources used |
|---|---|---|
| A | Government vital statistics | CDC/NCHS marriage count and rate |
| B | Large transaction dataset or large established survey | Check Cherry; The Knot Real Weddings Study |
| C | Commercial market estimate or scoped social poll | The Wedding Report; The Knot Worldwide Instagram poll |
| D | ATA calculation from cited figures | Budget shares, growth percentages and per-guest equivalent |
Check Cherry pricing data
- Roughly 118,000 aggregated and anonymized bookings from January 2024 onward
- Full event amount billed, excluding tips
- Wedding occasion recorded for approximately one-third of bookings
- Country-level composition not publicly disclosed
- Format comparison excludes roughly 62% of bookings with generic package names
The Knot 2026 Real Weddings Study
- 10,474 adult U.S. couples married from January 1 through December 31, 2025
- Respondents recruited through The Knot and/or WeddingWire membership
- Self-reported survey data
- The sample includes varied geographies, ages, identities and income levels
The Wedding Report
The Wedding Report provides commercial market estimates based on its own historical spending dataset. Its average, median, market size and wedding count should be attributed to the source rather than presented as government statistics.
Known public-data gaps
- Nationwide share of U.S. weddings hiring a photo booth
- Wedding photo booth prices by state or metro
- Wedding-only price by booth format
- Wedding-only attended versus drop-off prices
- Average wedding booth booking lead time
- Average number of booth sessions, prints or digital shares per wedding
- Verified guest-participation or satisfaction rate
- Wedding photo booth operator profit margin
Editorial disclosure: ATA Photobooths manufactures and sells photo booth equipment and may benefit from demand in the wedding-event market. Third-party statistics, ATA calculations and business interpretations are labeled separately.
Frequently asked questions
How much does a wedding photo booth cost?
The median measured wedding photo booth booking is $886. The middle 50% range from $631 to $1,305, and the highest-priced 10% exceed $1,973.
What percentage of the wedding budget is a photo booth?
The $886 median equals approximately 2.6% of The Knot’s $34,200 average wedding cost and 4.9% of The Wedding Report’s $18,231 median wedding spend. These are contextual calculations, not recommended budget rules.
How many weddings happen in the United States each year?
The Wedding Report estimates 2,011,044 U.S. weddings in 2025. The CDC separately recorded 2,128,446 marriages in 2024. The sources use different years and definitions.
How much is the U.S. wedding market worth?
The Wedding Report estimates $66.16 billion in U.S. wedding spending during 2025. The Knot Worldwide describes a broader wedding industry exceeding $100 billion. The two totals should not be averaged because their market definitions differ.
How many guests attend the average wedding?
The Knot’s 2026 Real Weddings Study reports an average of 117 guests and an average cost of $292 per guest among surveyed U.S. couples married in 2025.
How many vendors do couples hire?
The Knot reports an average of 13 wedding vendors. Two in three surveyed couples said hiring professionals was essential.
What is the busiest wedding season?
Approximately 76% of weddings take place from May through October. October and June each account for 16% in The Knot’s cited data.
How far in advance do couples plan weddings?
The Knot Worldwide’s 2025 Global Wedding Report found an average U.S. planning lead time of 15 months. It does not publish a separate average lead time for booking a photo booth.
What percentage of weddings have a photo booth?
No dependable current nationwide public statistic was identified. Precise claims should not be published unless the original survey, sample size, date and methodology can be verified.
Which photo booth type is best for weddings?
There is no single best type. Open-air booths support group photos and custom backdrops; DSLR booths emphasize image and print quality; mirror and enclosed booths provide a formal visual presence; roaming booths cover cocktail hours; and 360 systems create video-oriented content. The best fit depends on the venue, audience, package price and transportation requirements.
Sources and references
- Check Cherry — How Much Does a Photo Booth Rental Cost? A 2026 Pricing Guide. Updated August 10, 2026.
- CDC/NCHS — Provisional Number of Marriages and Marriage Rate: United States, 2000–2024.
- The Wedding Report — 2025 United States Wedding Market Statistics & Analysis.
- The Knot — The Average Wedding Cost, According to The Knot Data. Updated June 24, 2026.
- The Knot — 2026 Real Weddings Study Data Read-Out.
- The Knot Worldwide — 2026 Real Weddings Study Press Release. Published February 18, 2026.
- The Knot — Wedding Season and the Most Popular Wedding Months. Updated May 11, 2026.
- The Knot Worldwide — 2025 Global Wedding Report. Published August 13, 2025.
Recommended citation: ATA Photobooths Research Team. “Wedding Photo Booth Statistics 2026: Costs, Demand, Trends and Booking Insights.” ATA Photobooths, October 12, 2026.
Compare wedding-ready photo booth systems
ATA Photobooths manufactures portable and premium photo booth systems for digital rentals, attended wedding packages, on-site printing and specialty experiences.
Shop All Photo Booths Compare Full System Packages Explore Financing Options